Category:
V2 Redesign
Role:
Product Designer
Team:
Product Designer, Senior PM, entire web team (4 engineers)
Timeline:
Research & Discovery: 3 months; First batch updates 6-9 months
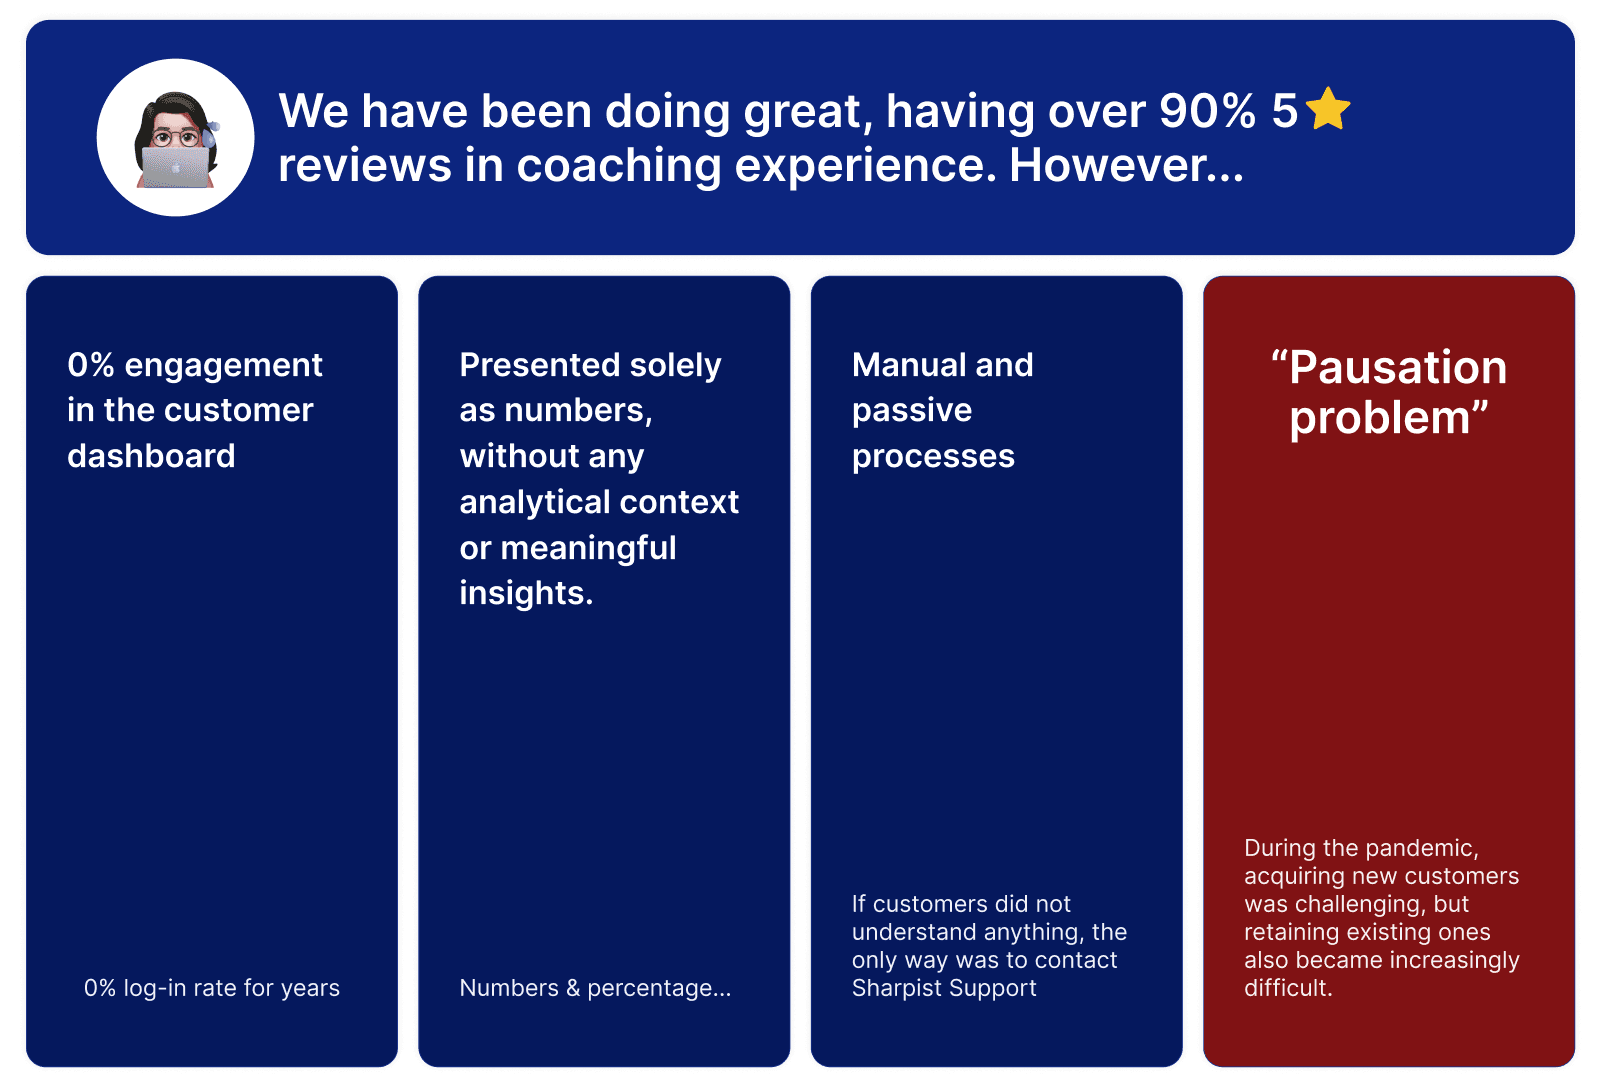
Sharpist, a B2B professional coaching platform, encountered a critical challenge in 2021: despite high user satisfaction with coaching sessions, the company struggled to attract new customers or retain existing ones solely through satisfaction rates.
The existing dashboard was fundamentally ineffective, failing to meaningfully reflect leadership transformation.
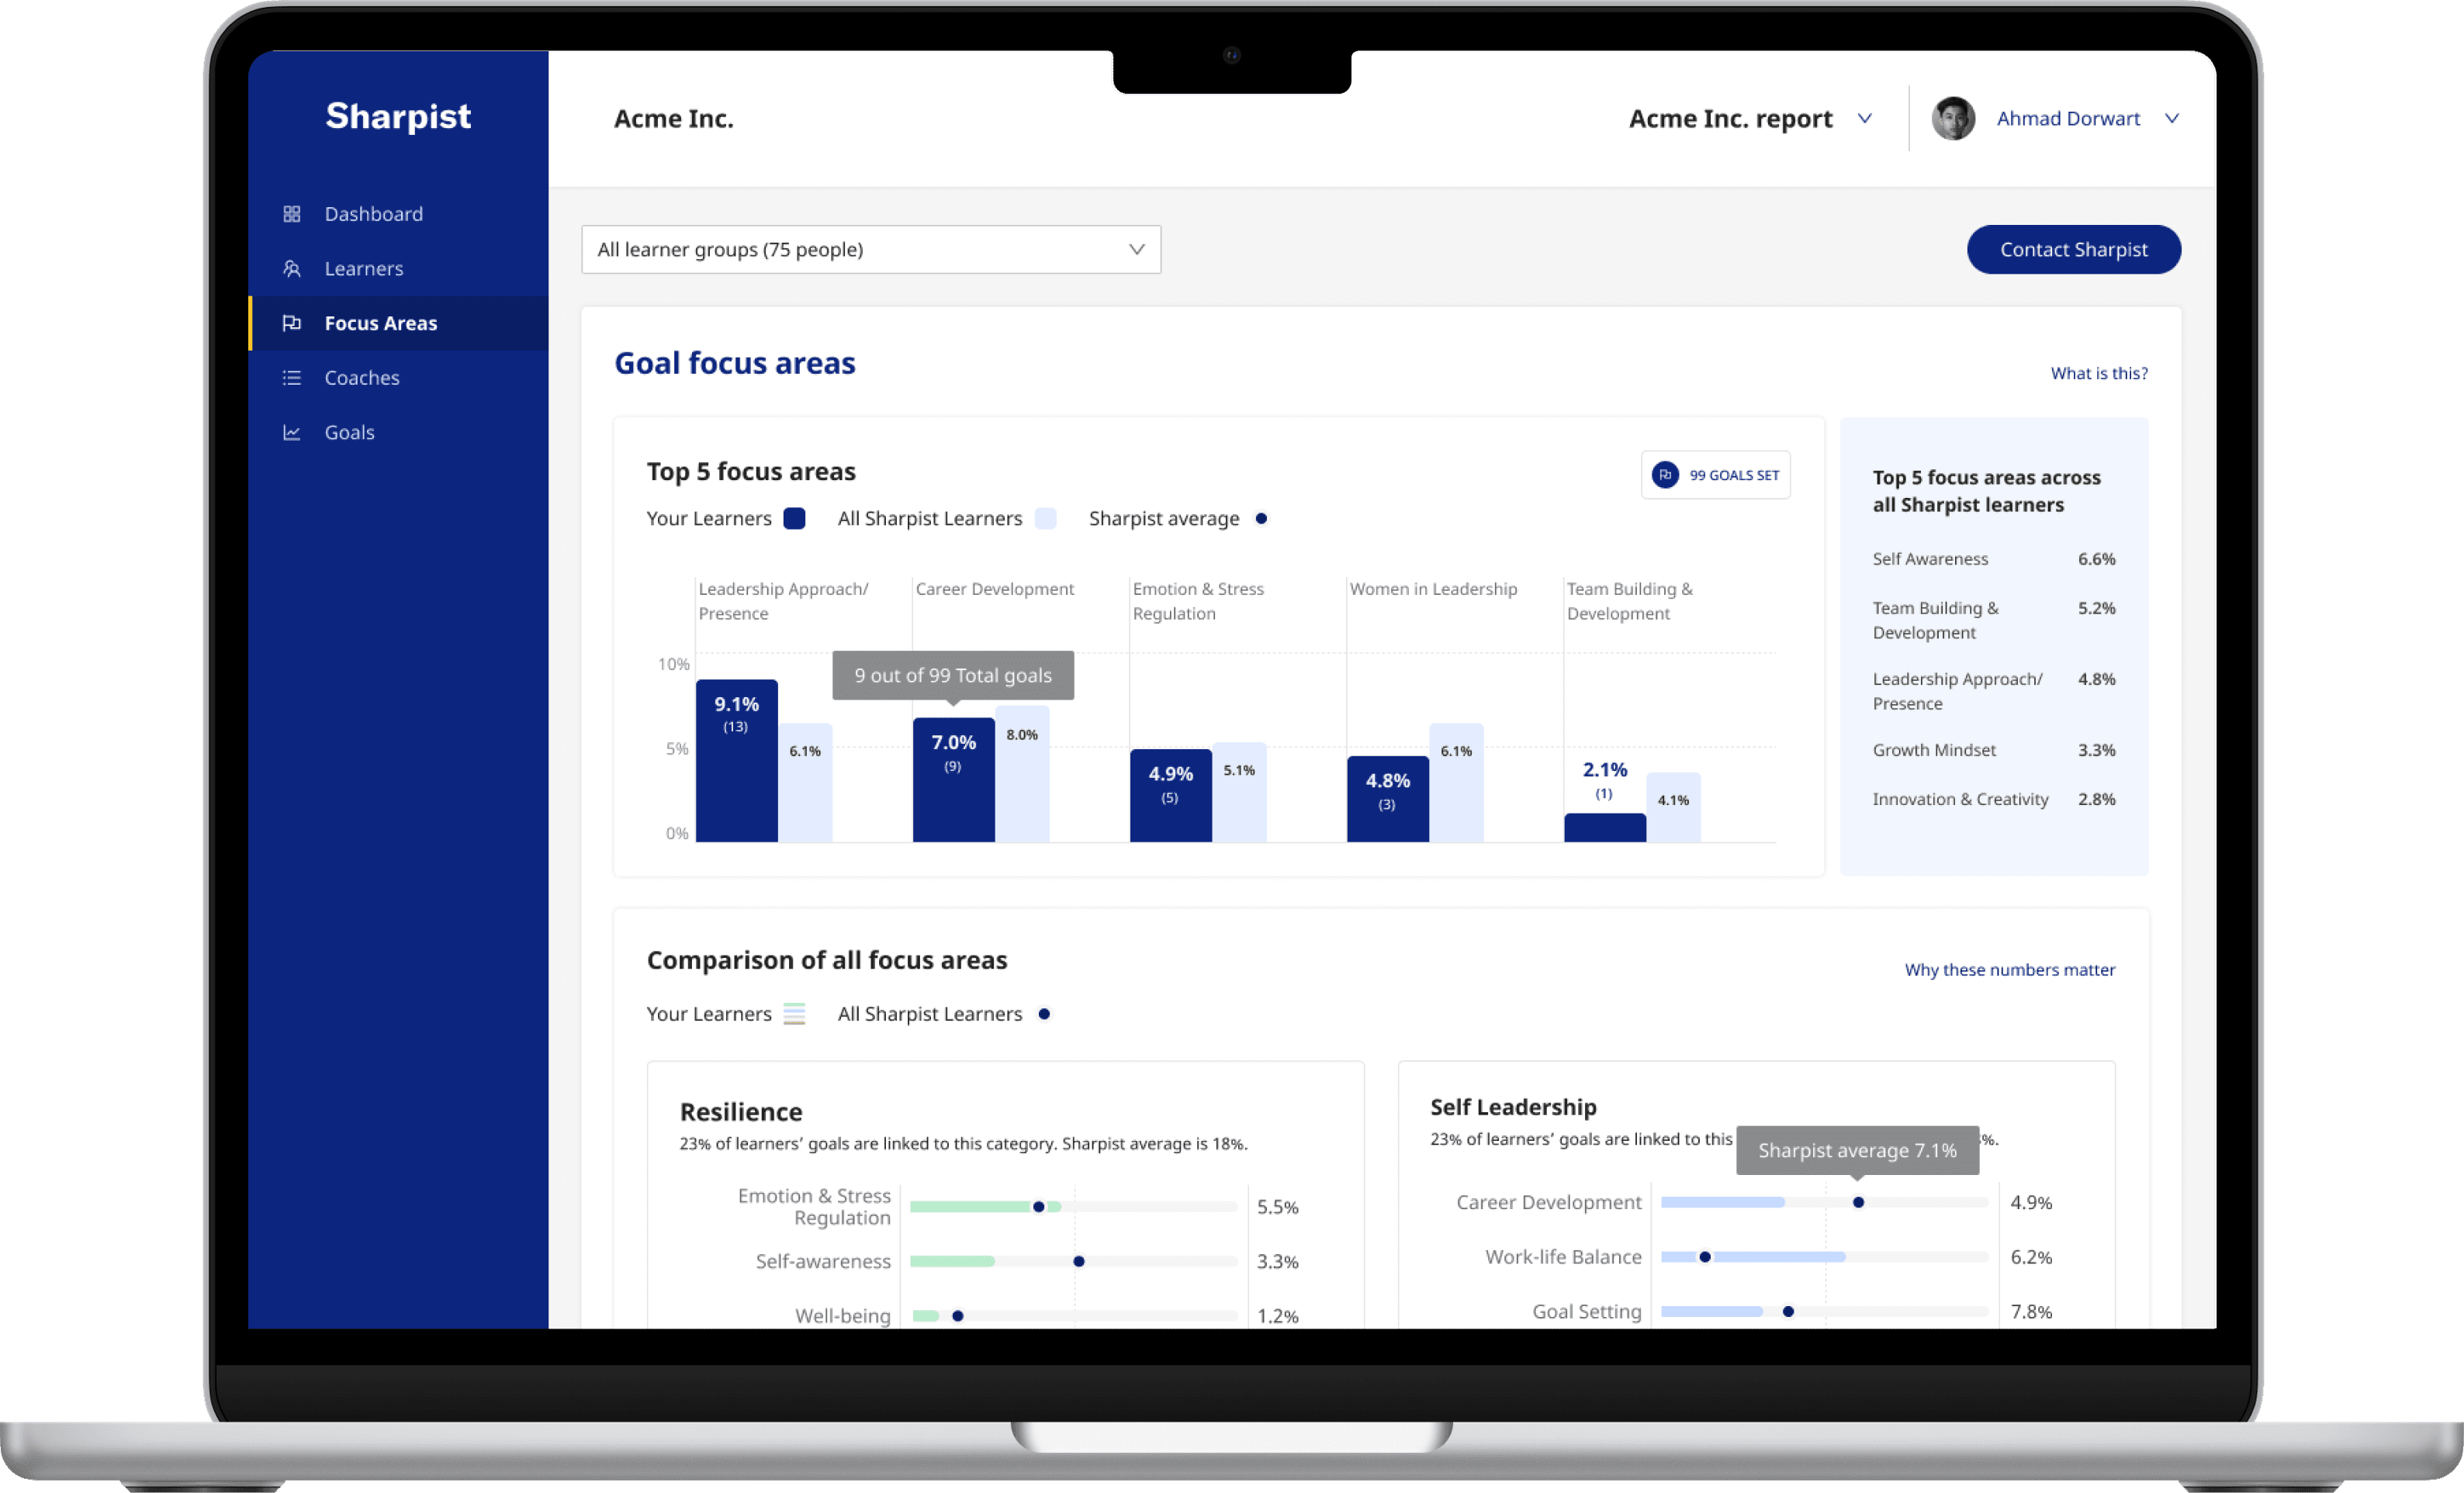
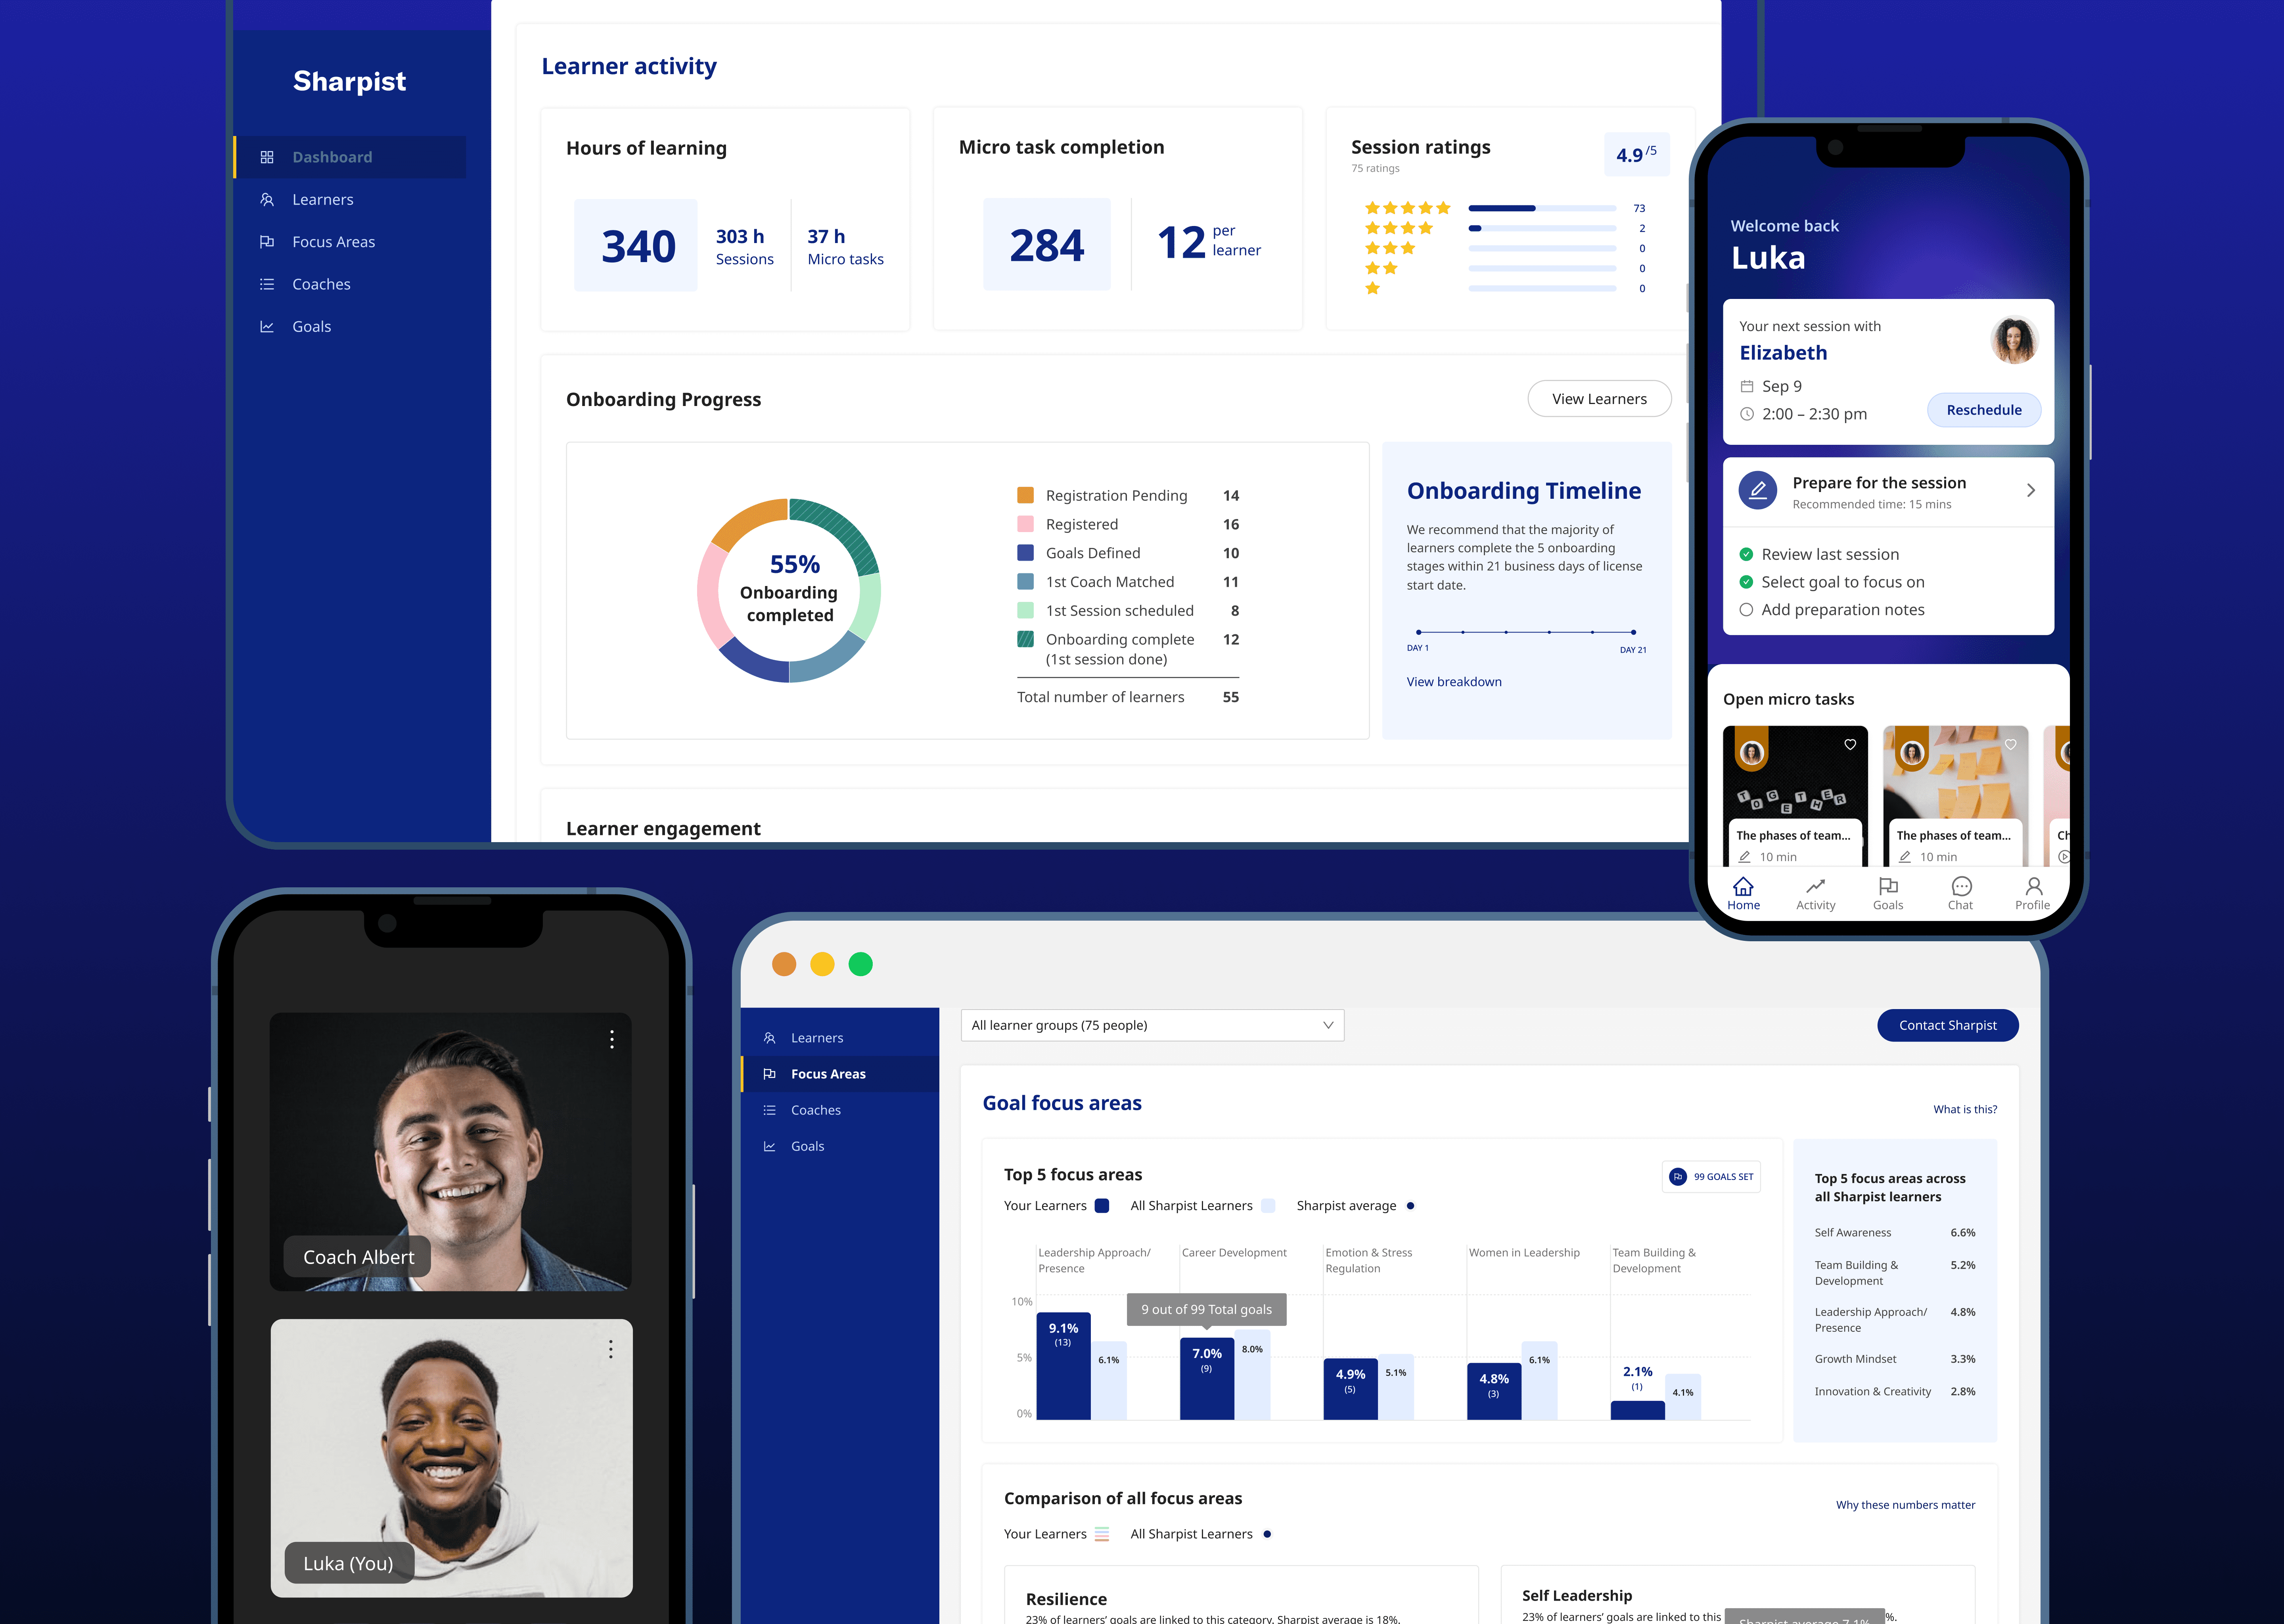
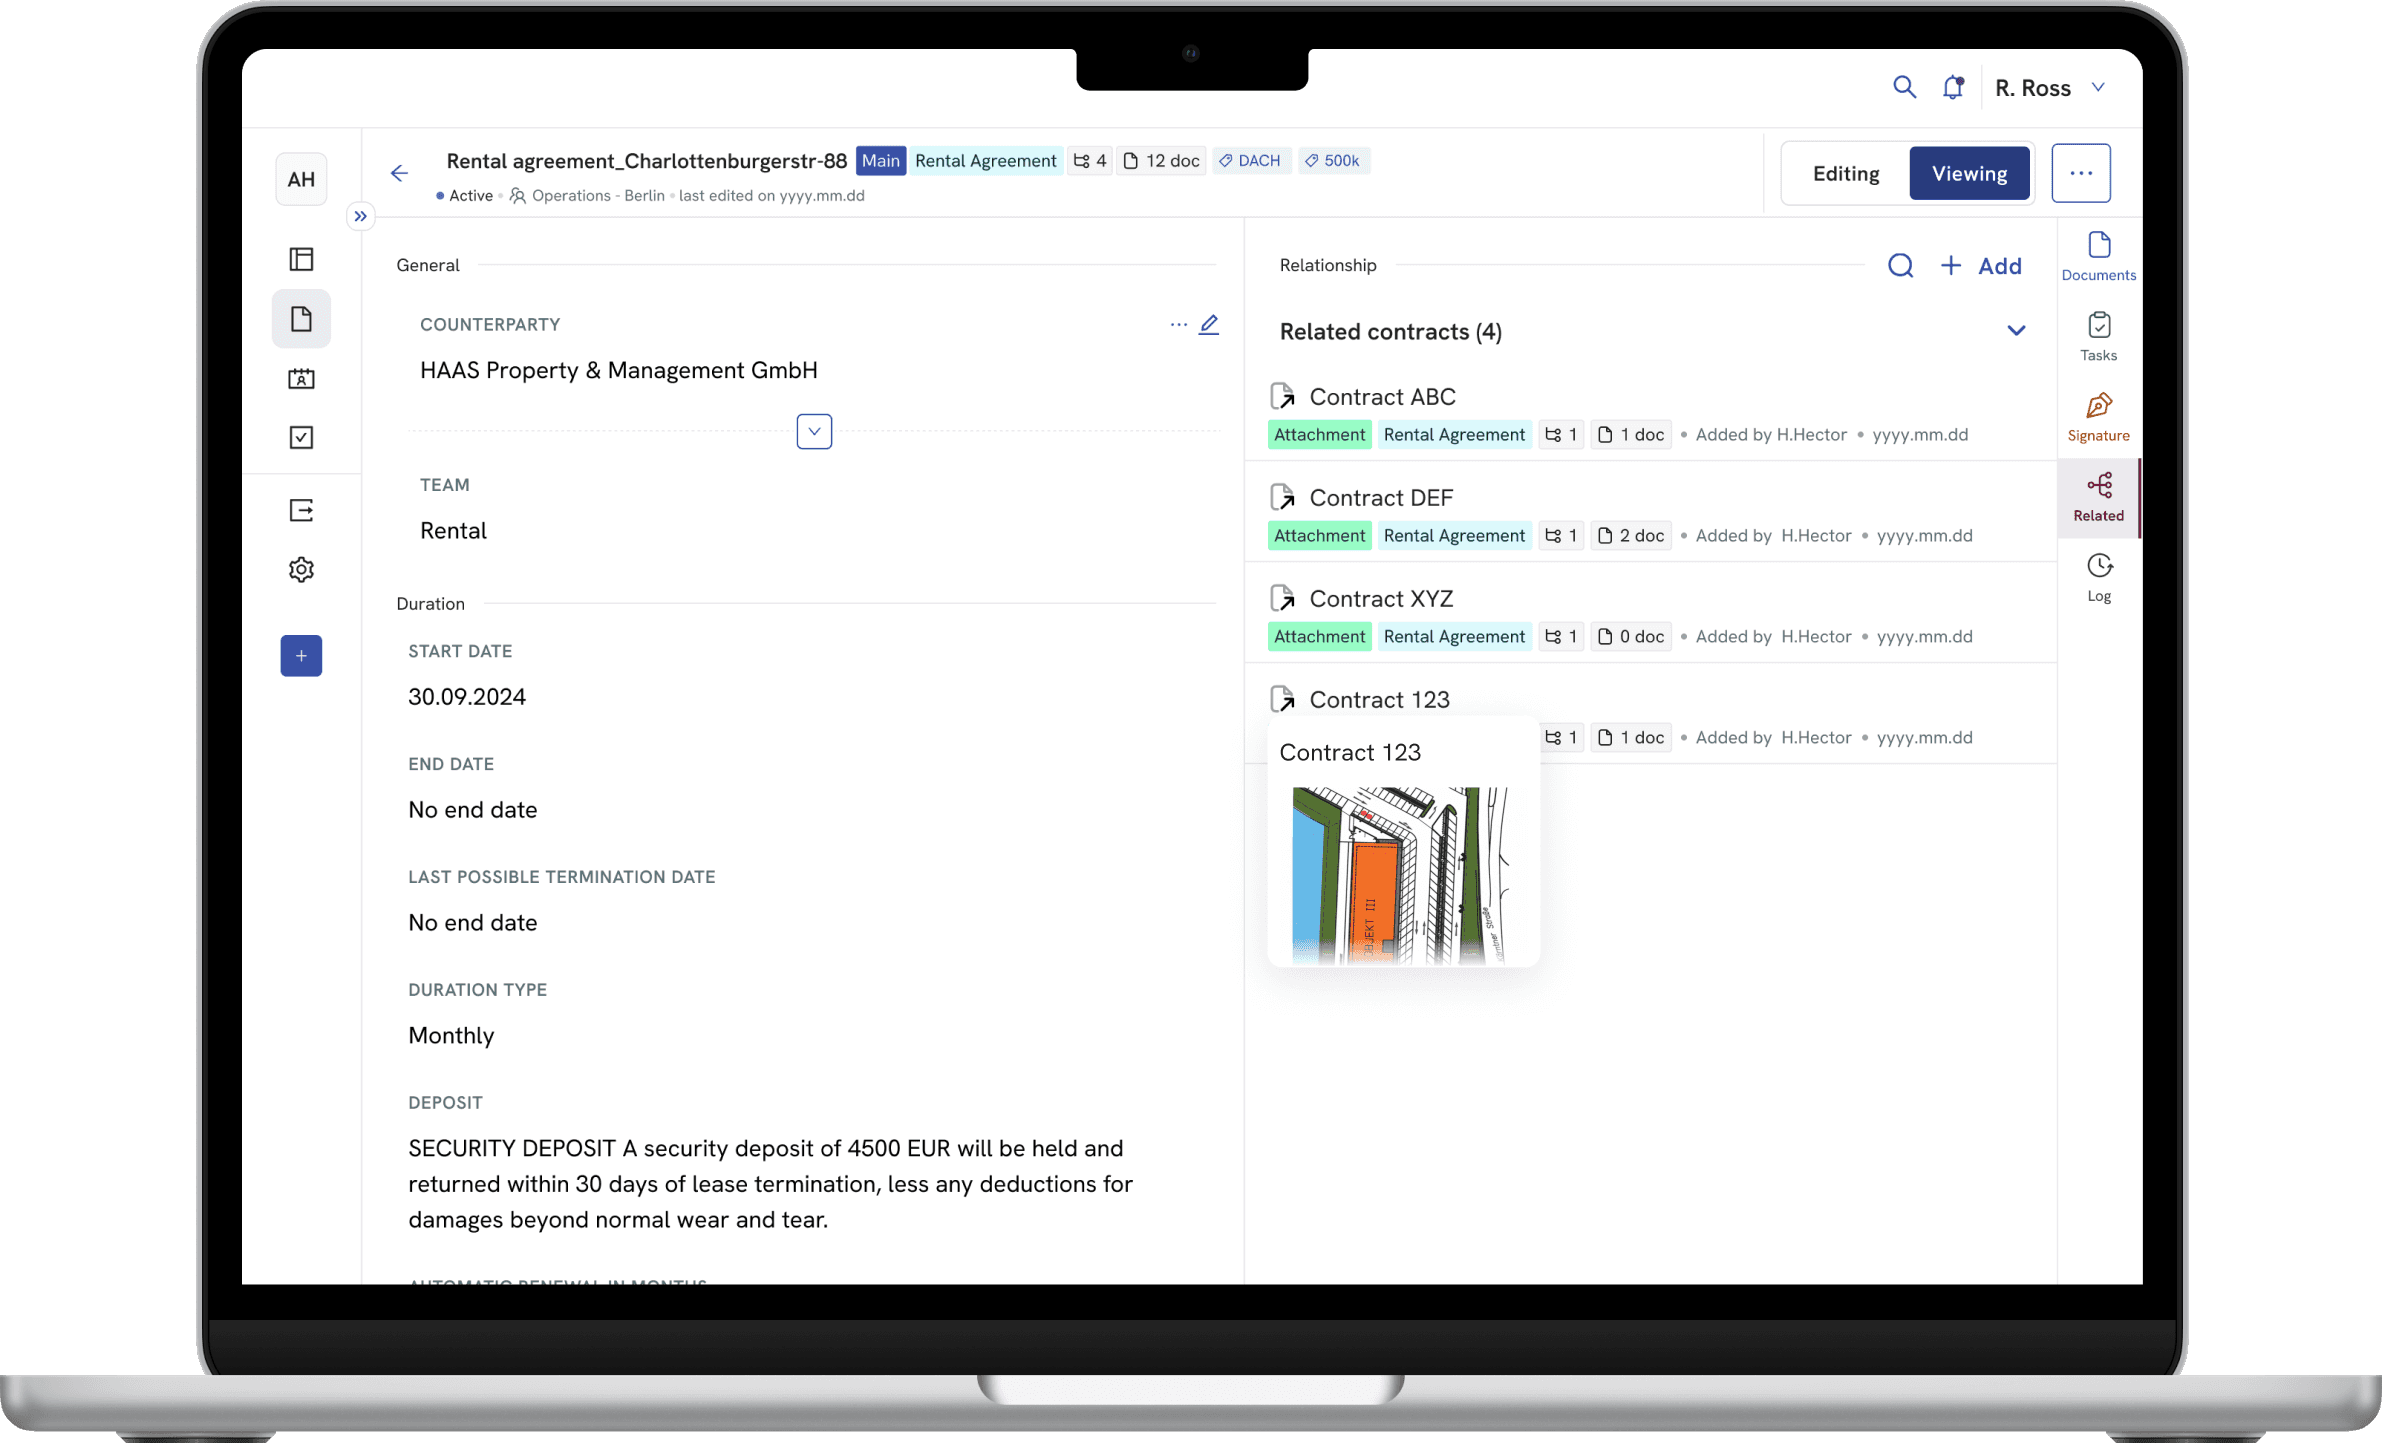
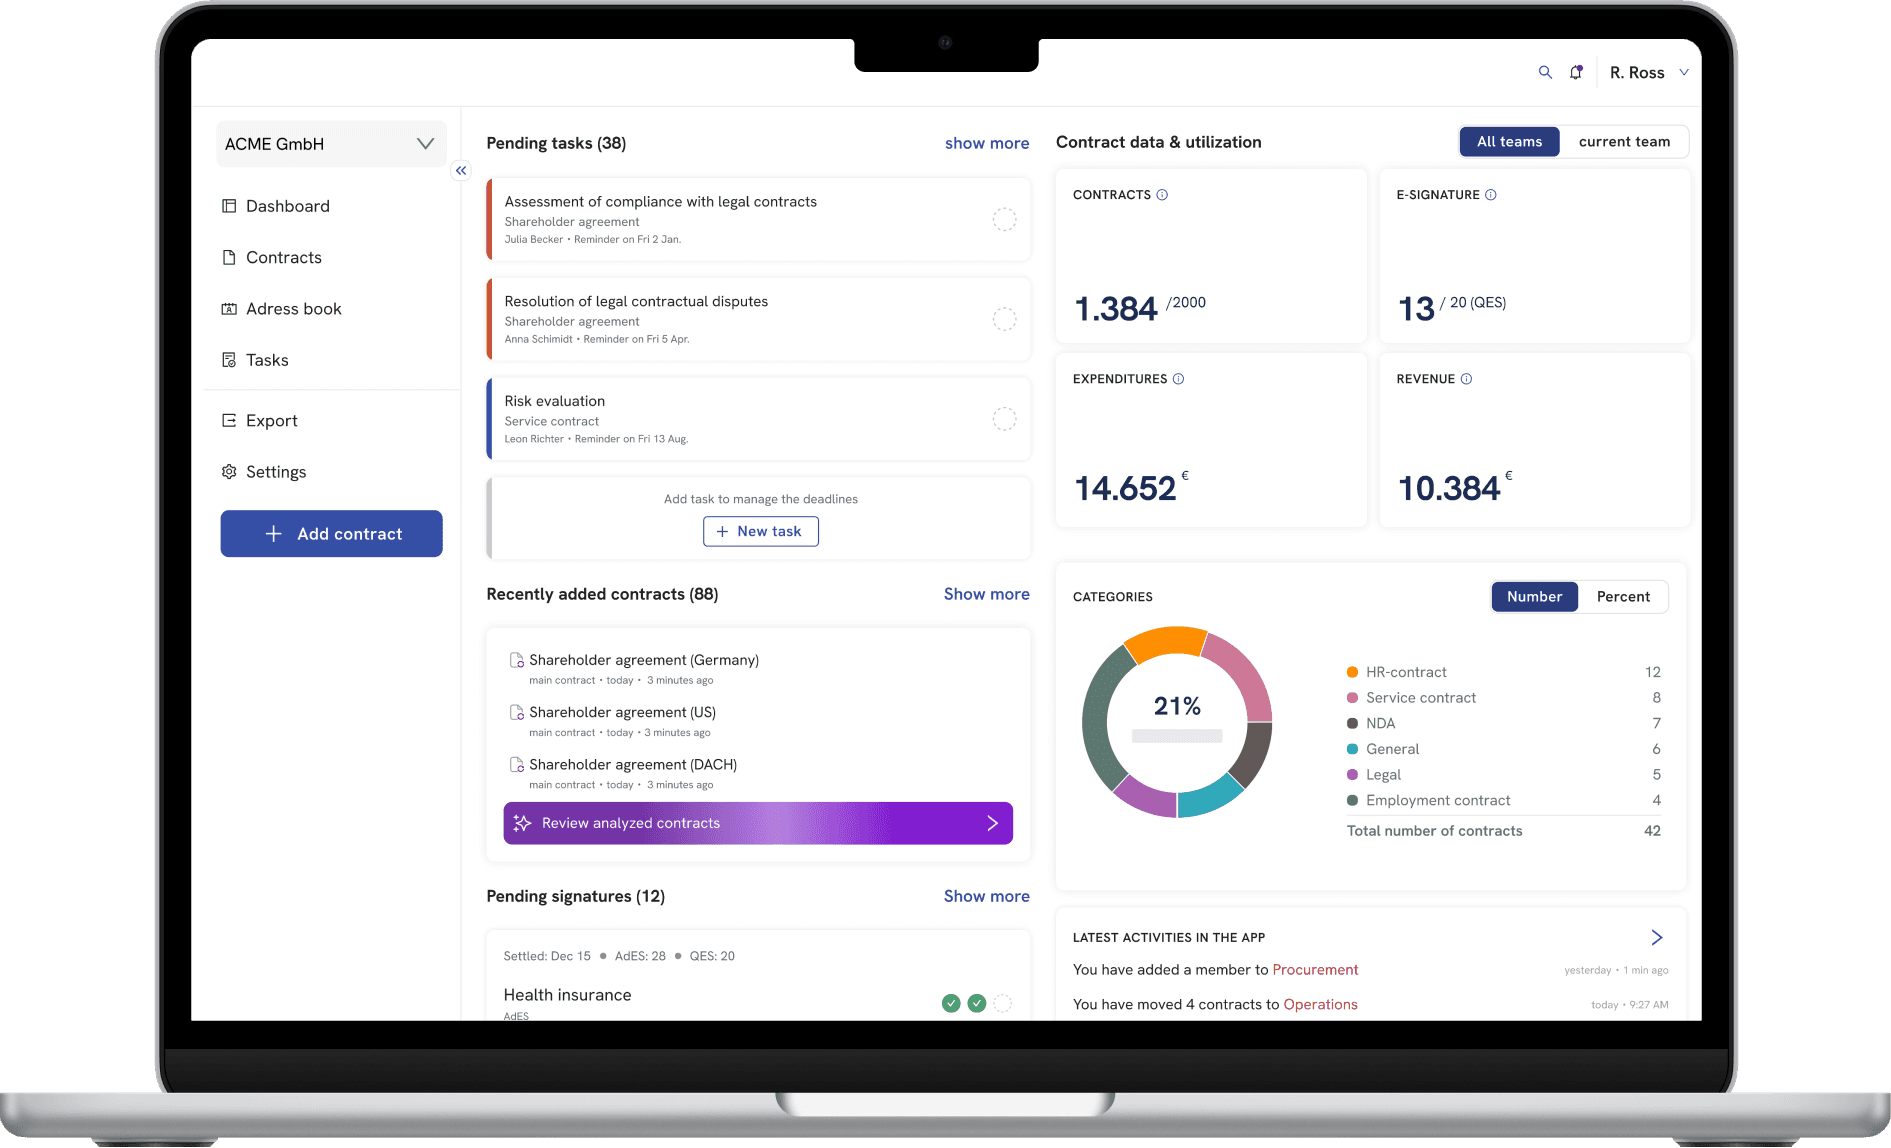
This portfolio documents the strategic redesign of the Customer dashboard—a critical reporting tool for tracking learners' progress after professional coaching, primarily used by HR and People leads.
IMPACT ————

CHALLENGES ————
This design gap resulted in two significant challenges:
Inadequate reporting capabilities
Inability to accurately demonstrate learners' developmental progress
Given the high cost of professional coaching, potential customers remained skeptical about the service's value proposition. This skepticism directly translated into hesitation about contract renewal with Sharpist.
Consequently, redesigning the customer dashboard became not just a priority, but an operational necessity to validate the coaching investment and showcase tangible learning outcomes.

While we have been measuring metrics to potentially track leadership transformation through Focus Areas, the current dashboard fails to translate this data into meaningful insights. Behavioural changes, inherently complex and nuanced, remain challenging to quantify. Consequently, the existing system provides raw data without context, leaving customers unable to interpret the substantive reasons behind shifts in focus areas.
Problem Discovery Process:
In collaboration with the Product Manager, we conducted a comprehensive two-round user interview with 6 key customers with over 100 active learners to deeply understand and address dashboard challenges—
1st Round: Explored pain points with the existing dashboard, gathering direct user insights and experience feedback.
2nd Round: Presented a design concept developed from initial metrics and user feedback, validating our proposed solution and iterating based on user responses.


SOLUTION SPACE ————

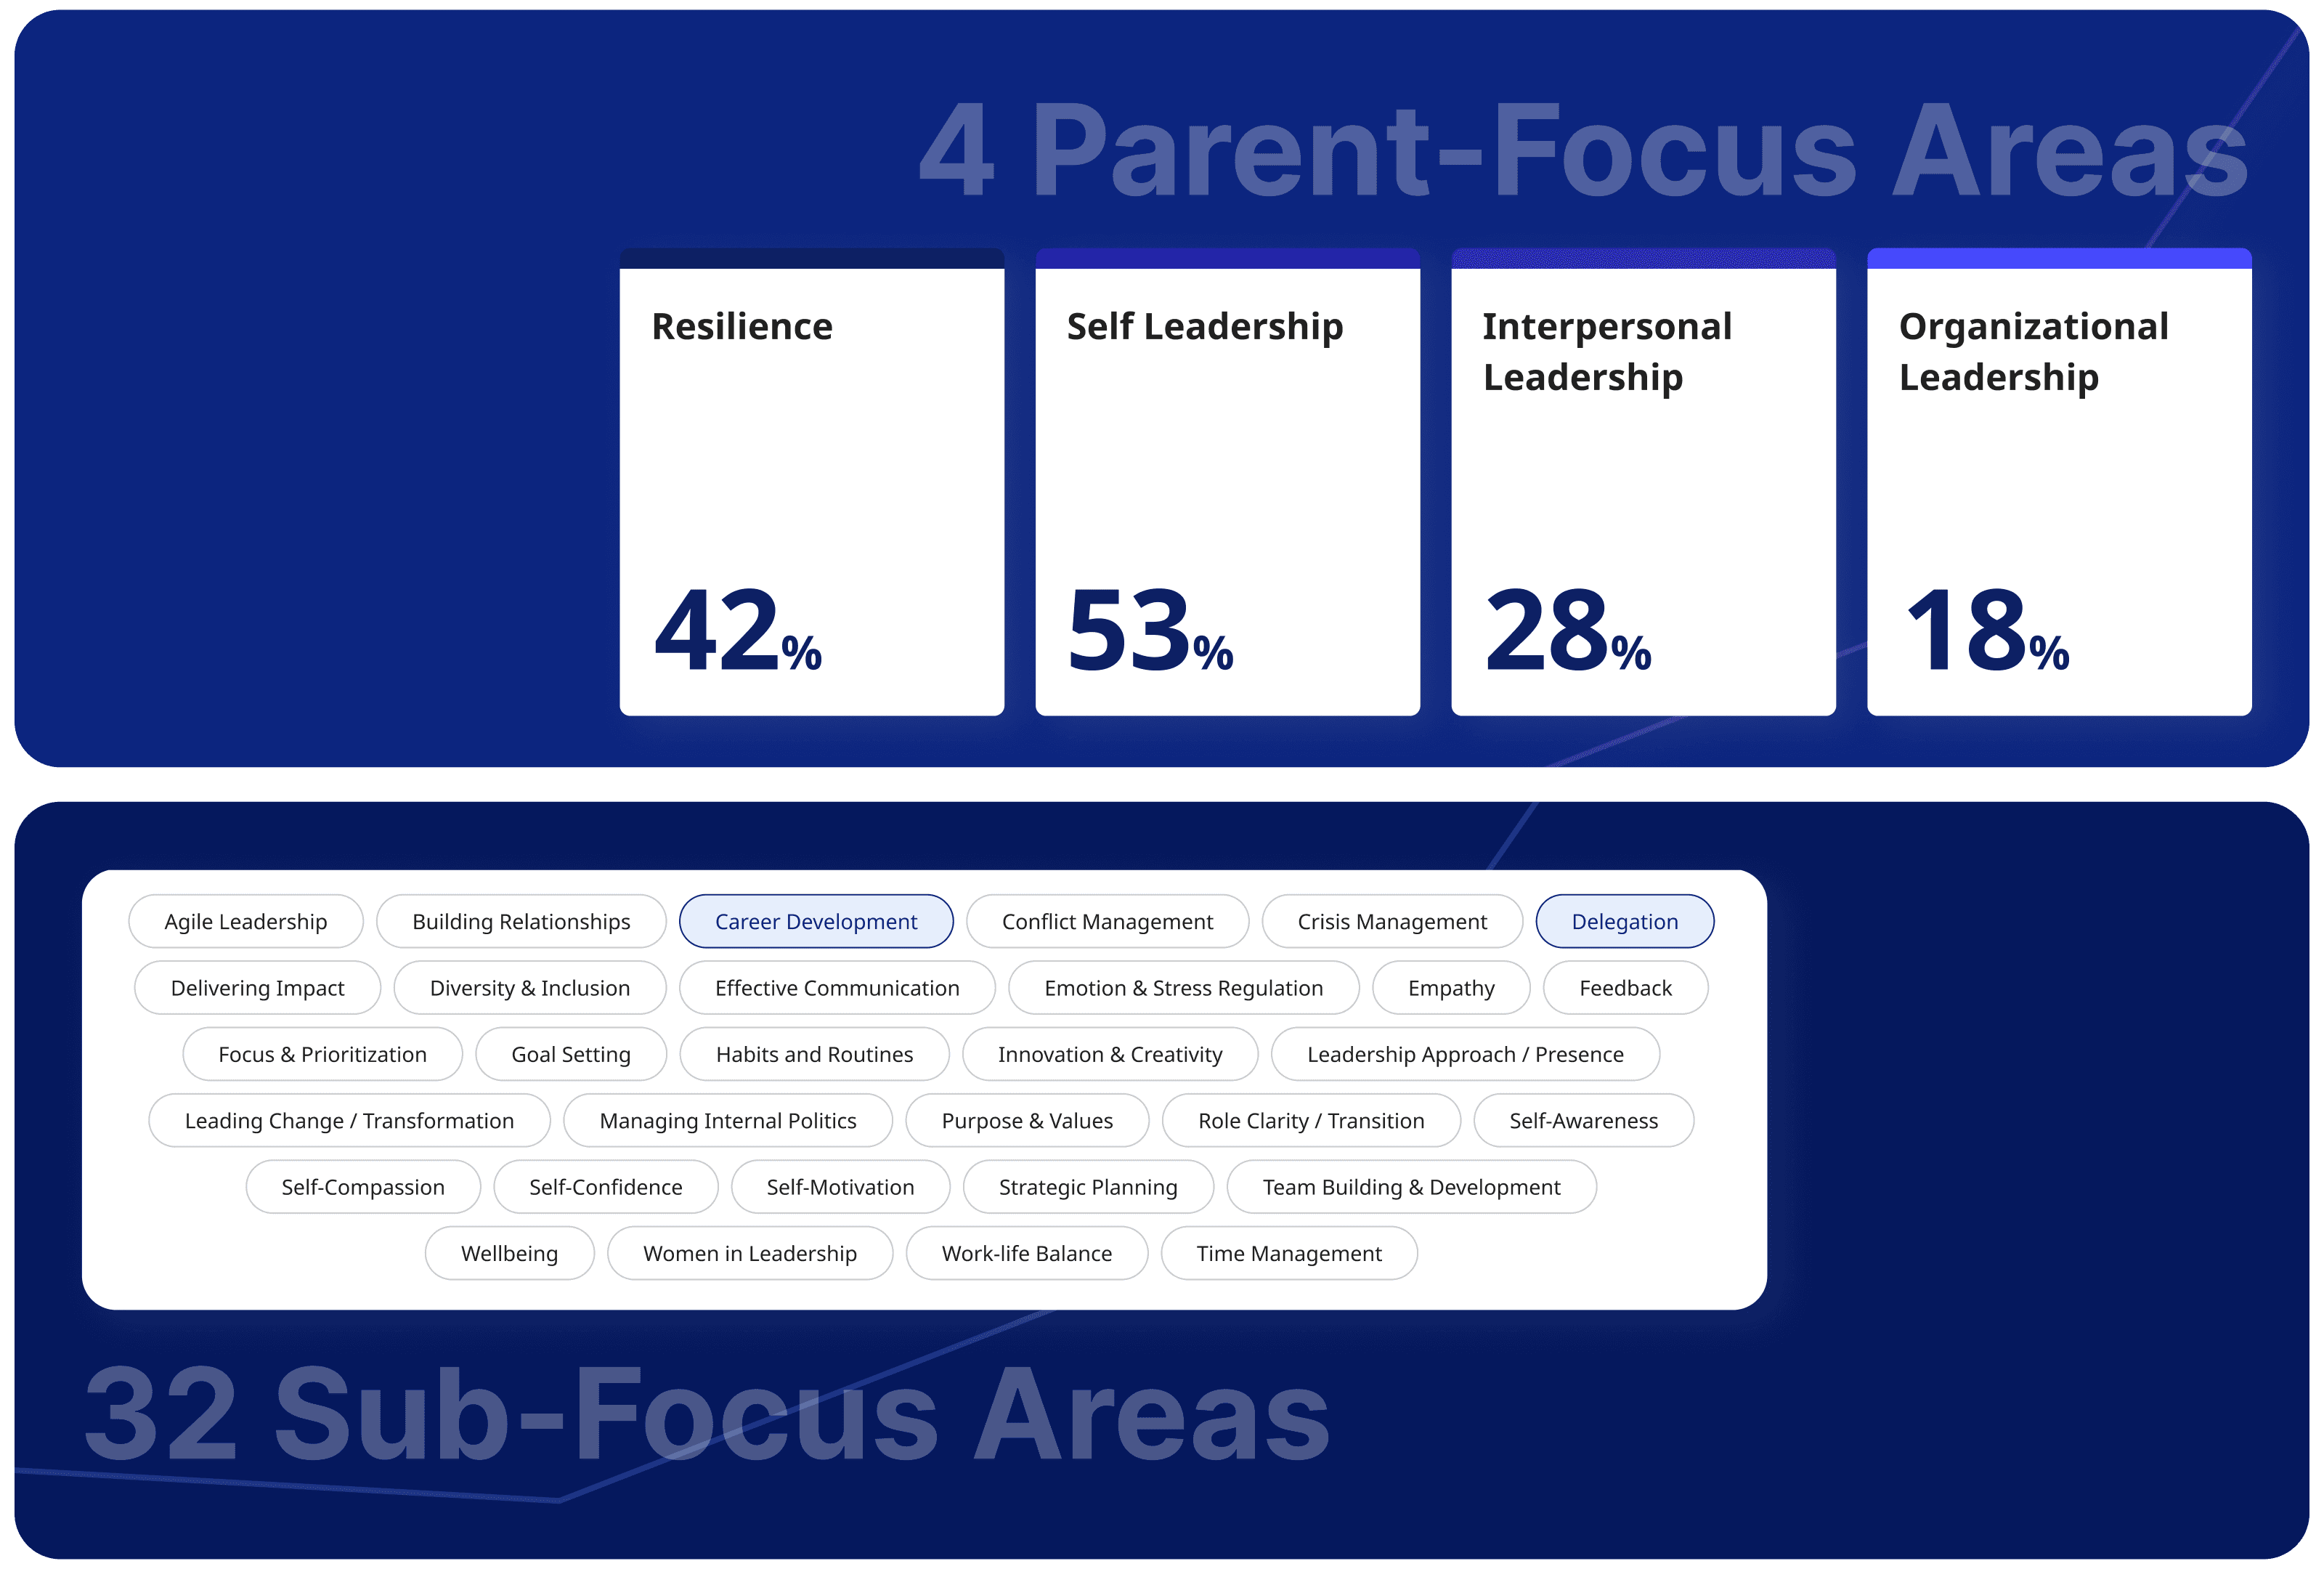
For instance, consider Alex, a senior designer enrolled in a 6-month leadership program. Initially, Alex's self-assessment centred on Self-leadership—emphasizing agile leadership, effective communication, and conflict management. As his focus areas organically shift from Self-leadership to Organizational Leadership, we can objectively demonstrate the coaching's impact on his professional growth.
The current dashboard failed to analyze and interpret these critical transition data, leaving customers unable to understand the percentage of focus areas stands for. By mapping these transformative journeys, we can transform intangible behavioural changes into meaningful, actionable insights that validate the coaching investment.
REFLECTION ————-
In V2, the dashboard will gradually become a self-service point that even in the absence of Customer Support, HR customers will still be able to get insights from the data reported.
